
Written by Webster Pacific Consultant Steve Bazant. Published by Propmodo on May 23rd, 2017.
My father, a seasoned commercial real estate broker, always told me that real estate is about “location, location, location.” While working in his office as teenager, I can remember hearing brokers arguing loudly about which neighborhoods were up and coming, what the residents were like, and where the most money could be made. After working in the consulting industry for several years, my company, Webster Pacific, has embarked on an analytical journey to better quantify “location, location, location.” To educate our clients, we have taken our own, novel approach to location analytics.
Location analytics means understanding the surrounding location of an investment property from the most critical perspective to ensure that you are making an educated investment. In the wake of globalization, analytics, and rapidly changing markets, the informed buyer must be cognizant of not just the actual building, but it’s surroundings as well: today and in the future. New properties enter the market, assets change hands, and new developments are built, which makes understanding your investment potential imperative. Location investments are only made once; so the savvy investor must use location analytics to ensure that her one-time buy is an educated and safe one.
Current: Neighborhood Environment
The first step to understanding the location of your investment is getting texture on what the neighborhood around your investment is currently like. The traditional method would be to visit the neighborhood and observe as you walk around. Look at the options for food. Are the local stores Starbucks and Whole Foods or McDonalds and KFC? Keep an eye out for the people walking around on the street. Do they appear to have walked out of a Neiman Marcus catalogue or a thrift store? This outdated method is what we call gathering unstructured data, because it is not quantified or methodical. However, this data is extremely important to property value, so Webster Pacific has developed metrics and maps to put numbers to what was previously intuition.
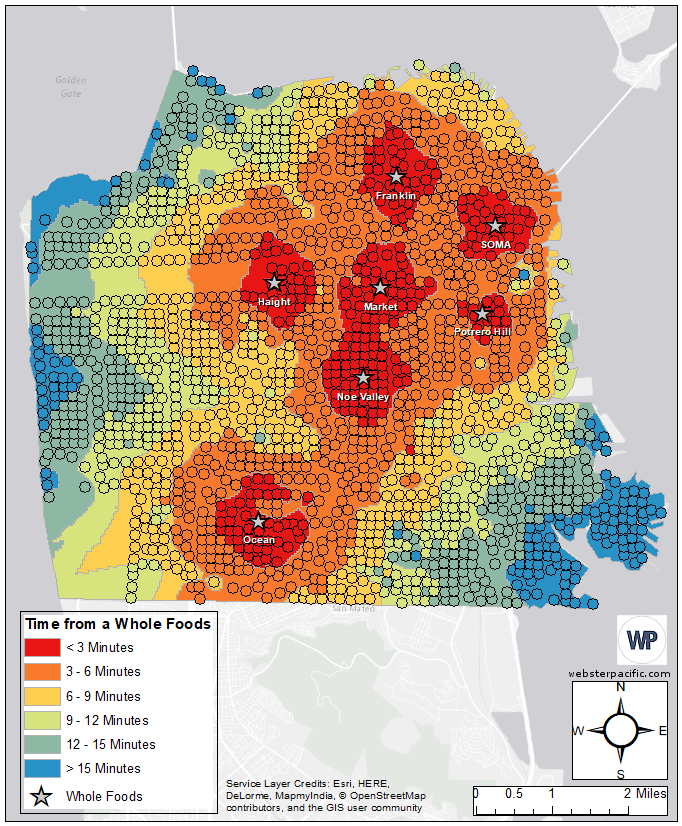
One example of unstructured data that we have quantified is the distance from any location to a Whole Foods. There are two valuable insights with regards to the value of your property when considering Whole Foods. First, as you would assume, tenants appreciate the proximity of a grocery store, particularly a luxury one, even if they choose not to shop there. Food deserts are a serious concern for residents of some neighborhoods, so understanding proximity to quality groceries is valuable. Second, Whole Foods has an impact on neighborhood property value. Due to the nature of the size and target market of their corporation, Whole Foods spends millions annually on placing stores in high income or growing neighborhoods. Therefore, they have developed a reputation of increasing property values in neighborhoods just by entering the market. The following map displays the drive time to a Whole Foods in the San Francisco market. For anyone who has local knowledge, they will recognize that every wealthy neighborhood of San Francisco is within a 6 minute drive of a Whole Foods. However, one can gain insight into neighborhoods like East Mission, which has coverage, but has yet to gentrify. Purchasing real estate on Mission Street would be an intelligent investment when considering this movement of gentrification.
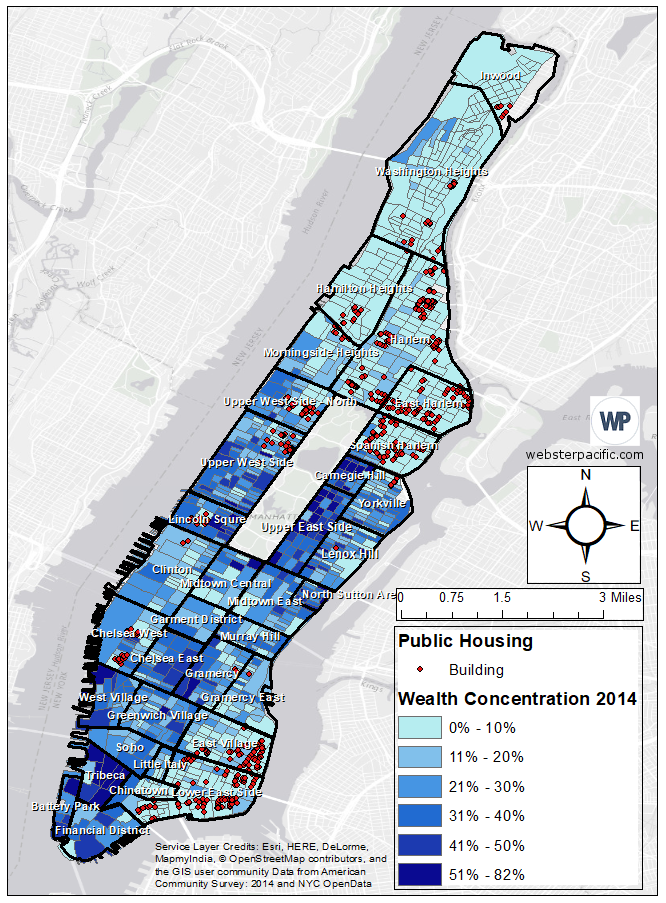
Before purchasing a property, it makes sense to understand which income bracket your tenants will be in. This can impact the management and investment of your property from unit pricing to marketing. Consider the below map of Manhattan. It depicts the density of wealth on a granular, block by block basis, with dark blue indicating high wealth (and therefore high property value) and light blue indicating low wealth. Furthermore, there is an overlay of every public housing project in the entire city. Now, for any location in Manhattan, one can determine the average income of households earning over $200k USD and the distance of your prospective investment from public housing. Both data points can have significant impacts on property value, but are difficult to quantify with intuition alone.
Future: Gentrification
Today, gentrification is considered a crass word, devoid of empathy; however, it is a worthwhile phenomenon to investigate when investing in a piece of real estate. Gentrification, from a data perspective, is merely the net movement of wealthy people into a neighborhood. In terms of real estate, this means increasing property values over time. One might consider the importance of knowing whether the neighborhood of your investment will be increasing or decreasing in wealth and population due to the implications on property value. Depicted below is a map of Manhattan, projecting where and at what magnitude real estate property values will be changing in the future using historical census demographics (population), historical real estate property sales, and historical household income estimates from the American Community Survey. To state simply, red areas indicate high growth in property value in the next 5 years and blue indicates low to negative growth. If you are considering two comparable investments, one in the neighborhood of Chelsea and another in the Upper West Side, the educated investor would buy in Chelsea.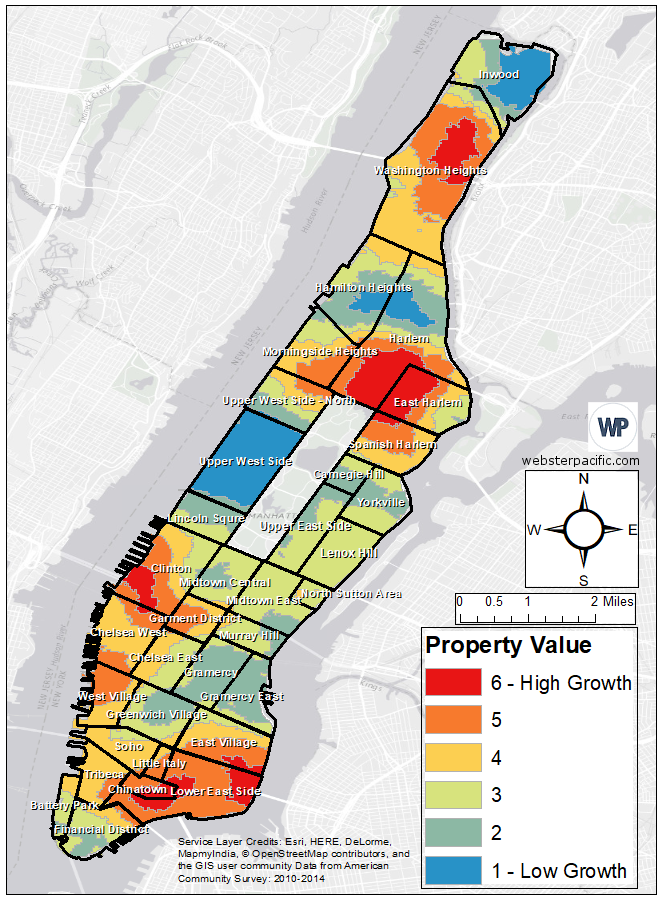
Future: Planned Developments
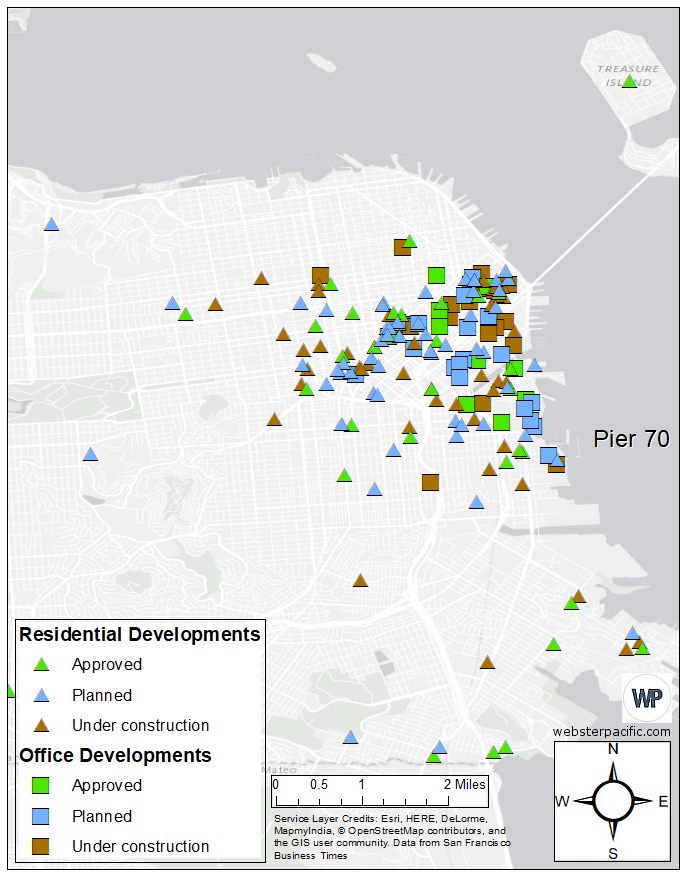
Imagine that you buy a residential investment property for a fair price in an up and coming neighborhood. You list apartments at market rate and the building fills with tenants within a year. After three years of collecting steady rent, you are surprised to see that the property next to yours gets knocked down and redeveloped. If that lot is developed into a new modern art museum, your rental prices increase dramatically, but if that property is developed into public housing, your rents plummet. Furthermore, property developments are not the only types of development one must be cognizant of, for government projects can have glaring impacts on value as well. Consider a rail line extended to the neighborhood, facilitating public transport into the city, or a public park that softens the concrete empire surrounding your building. By aggregating and carefully curating city planning data, maps can be created with projections of developments, along with detailed reports on each project. Consider this map below of planned developments in San Francisco. Each shape represents a residential or office development that is in varying stages of completion. For example, a particular blue triangle on the eastern shore of San Francisco represents a planned development on Pier 70. Would you invest in a property in Dogpatch if you knew in three years 1,500 units will be finished at pier 70, just blocks away?
Real estate used to be an industry where decision-making was based on intuition and seat-of-your-pants thinking, but as The Economist puts it, “The world’s most valuable resource is no longer oil, but data.” An educated investor will want to buy property in an area where the data says that it is increasing in wealth and surrounded by planned developments that are of high quality. Location analytics is a form of insurance to give buyers peace of mind and, in the next 5 to 10 years, it will become an industry-wide standard.
Propmodo is an online news source that focuses exclusively on commercial real estate technology. This article was originally published on May 23rd, 2017 on Propmodo.