Curating means selecting, organizing, preserving, and displaying information so that our clients, at multiple levels of their organization, can digest it easily.  The curatorial process results in reports and data visualizations that answer questions, quickly and cleanly. Our goal is to help clients effectively visualize data, with purpose.

CASE STUDIES

Academic Data Visualization

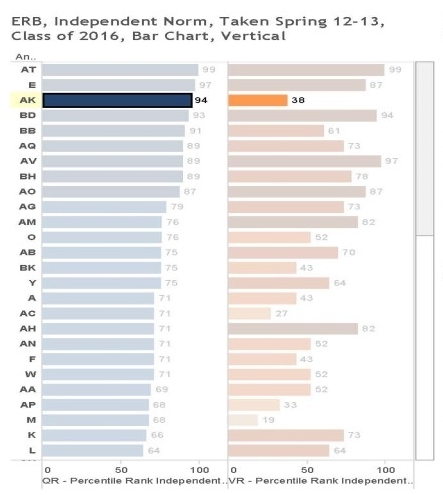
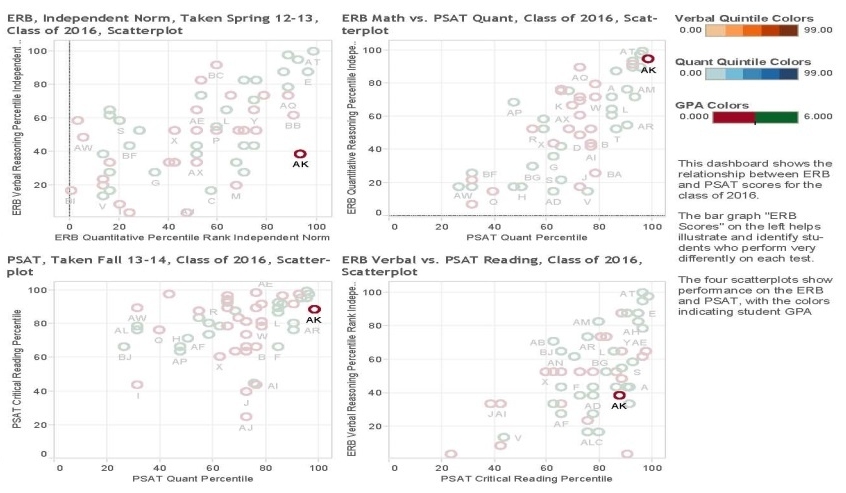
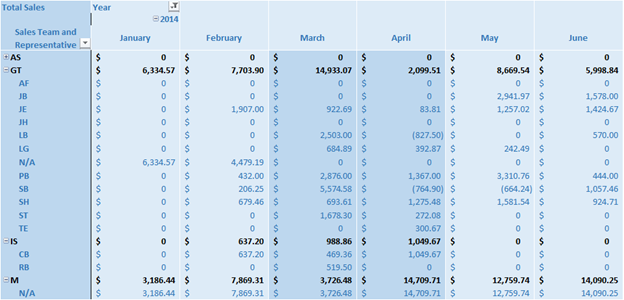
Question: How can we visualize class performance and test results for analysis, comparison and decision-making?

Approach: Webster Pacific helped a private school client implement Tableau, a robust data analysis and visualization tool. Tableau allows for central analysis and distributed online viewership.

Result: Client was able to see and act upon ‘one version of the truth.’ This, in turn, led to consistent organizational learning and data-driven decision-making.

Agriculture Client Budgeting

Question: How does a client organize and visualize its sales data to influence the budget for the upcoming year?

Approach: The client, an upscale olive oil producer, had been aggregating sales data by retailers, sales representatives, and sales teams for a number of years; however, they did not have the expertise to manipulate the data to gain useful financial insights. Webster Pacific served the client first, by cleaning their historical data and creating a system for future organized data entry. Second, Webster Pacific developed multiple models and visualizations to help educate the client on how they could project their budget for the upcoming year.

Result: Webster Pacific delivered a robust model, which empowered the client to gain insights from their own data and streamlined their data collection and curation process.